Archive
Is Amazon a “Buy” After Its Recent Price Correction?
In this post I will analyze Amazon, Inc. (AMZN) from a fundamental perspective, and estimate how close the stock price is to fair value after its steep correction, which was triggered by slightly disappointing sales growth (see story on Bloomberg.com). All the tools I use to write this article are featured in my recently-published book, Applied Equity Analysis and Portfolio Management, which also contains a more detailed case study on Amazon’s valuation, and an interactive spreadsheet that allows users to study and model the company’s metrics in even greater depth. As you read the following analysis, bear in mind that the process featured in the book focuses on whether or not a stock is suitable for a fundamentals-based buy-and-hold portfolio.
Amazon makes an interesting valuation case study because it continues to perplex professional analysts, as it has done for years. In a report dated Jan. 31, 2014, Michael Souers of S&P’s Capital IQ downgraded Amazon all the way to “sell,” with a 12-month target price of $350, while a team of 4 analysts at Credit Suisse left Amazon at an “outperform” rating in a report with the same date, estimating the fair value of the stock to be closer to $450. Even after its recent revenue miss and price decline, it is clear that analysts’ opinions remain divided.
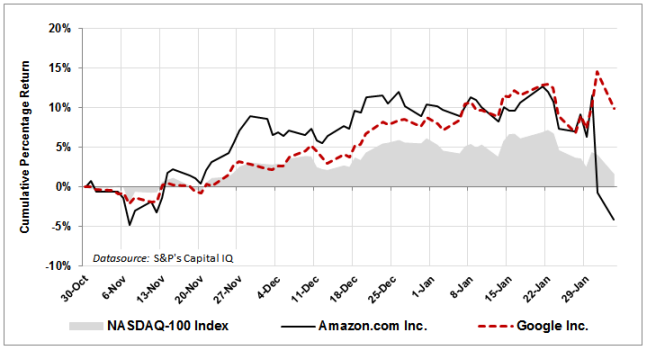
For both the past year and last 3 trading months (shown below), Amazon’s stock delivered returns similar to another NASDAQ favorite, Google (GOOG), but Amazon’s Jan. 30-31 price decline stands out:
 In terms of dot.com-friendly valuation ratios, such as price/sales, Amazon even looks like a bargain compared with a stock like Google:
 And, with all that fast revenue growth, Amazon is also competitive in terms of revenue/share:
 But that’s where the similarities end. From a fundamental perspective, investor concerns regarding Amazon’s valuation can be seen by comparing 3-year growth rates (CAGRs) in key value-creation metrics:
 Amazon’s 3-year revenue growth is exemplary, but from Dec. 2010-Dec. 2013, earnings before interest and tax (EBIT), net operating profit after tax (NOPAT), EPS and free cash flow (FCF) all contracted dramatically. A multi-year record of selling more and earning less will make it hard for a stock like this to qualify for inclusion in a fundamentals-based portfolio.
Amazon’s valuation problems can be traced to declining operating margins, which means fewer sales dollars get pushed into EBIT, and thus NOPAT and FCF, which hurts its per-share valuation. Amazon’s operating margin compared to Google is vapor-thin:
 and does not compare favorably even with a traditional discount retailer like Wal-Mart:
 With such a low operating margin, and thus EBIT and NOPAT, Amazon’s return on invested capital (ROIC) is lower than its weighted average cost of capital (WACC), and thus too low for it to create intrinsic value:
 Thus, while Amazon has market value-added (MVA) per share that’s comparable to Google:
 and far superior to Wal-Mart:
 Amazon does not measure up in terms of value-creation metrics such as economic value-added (EVA) per share:
 or free cash flow per share:
 A multi-year trend of soaring MVA and declining EVA is symptomatic of the type of overvalued stock we want to avoid including in a portfolio that’s focused on fundamentals:
 Credit Suisse’s Jan. 31 report provides their analysts’ per share estimate of Amazon’s fair price using discounted cash flow (DCF) analysis. Their fair-value price of $449 is based on a WACC of 10.5% and perpetual growth of 3.0%. Next we will use the spreadsheet tools that accompany my book to forecast Amazon’s future trajectory and run our own DCF analysis.
Several of Amazon’s income statement items need adjusting in the forecasts; these are shown in the table below:
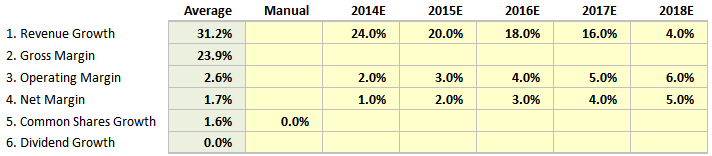 Revenue growth for the past 5 years averaged 31.2% per year; this is tapered from 24.0% in 2014 (per S&P’s Capital IQ) down to 4.0% in 2018 and beyond, 1.0% more optimistic than Credit Suisse. Although operating margin averaged 2.6% historically, it’s been in a downtrend, so we smooth operating margin back to 6.0% by 2018, which is 1.2% higher than the company has achieved in the past 5 years. Net margin is also smoothed upward proportionately, and we fix share growth at 0.0%, which will also help AMZN’s DCF valuation. The only balance sheet assumption that I changed was property, plant and equipment (PPE) to sales — Amazon has been investing heavily in recent years, and it’s reasonable to assume that these investments will begin paying off, so their PPE/Sales ratio was tapered from 14.7% in 2013 all the way down to 8.0% in 2018 (lower capital intensity will increase pro forma ROIC and FCF, and thus per share valuation).
Amazon has a beta vs. the S&P 500 over the past 5 years of 0.90, but over the past 2 years their beta has been 1.47. To model an optimistic scenario, I leave their beta at 0.90 and estimate a WACC of 8.1%, considerably lower than Credit Suisse’s 10.5%. This will also help Amazon’s per share valuation.
As shown below, the optimistic forecast scenario restores Amazon’s operating margins to 6.0%:
 Return on equity (ROE) and ROIC expand robustly:
 as do NOPAT and FCF:
 Despite all the optimistic assumptions, Amazon still models up as overvalued using DCF analysis, however:

My per-share fair value estimate of $309.63 is closer to Mr. Souer’s. Despite modeling an optimistic future trajectory for the company, Amazon’s share price has risen faster than the company’s ability to generate fundamentals such as EBIT, NOPAT, free cash flow and economic value-added.
Conclusion: Amazon’s recent price correction is appropriate for its extended valuation, but the stock still has another 14% to go on the downside before it would represent fair value to a fundamentals-focused investor. The stock has an amazing investor base, however, so this is in no way a prediction of a negative price path for Amazon — many investors appear unfazed by its current P/E ratio of 600+, and the stock has rallied a bit off of its recent bottom. While it may be appropriate for some investor’s portfolios, Amazon does not meet the value profile for inclusion in a fundamentals-based portfolio at this time.
Disclosure: The author holds no shares of Amazon at the current time, and has no plans to initiate a new position.


S&P 500 Forms Ominous Technical Pattern
[02.16.14] I look forward to fund manager John Hussman’s blog posts each week (hussmanfunds.com). John is an experienced market researcher, but in some of his articles last year he reflected on his overvaluation concerns, which were similar to those expressed by Jeremy Grantham’s team (read GMO’s November 2013 newsletter here regarding asset overvaluation in 2013).
Hussman’s February 17 post contains some dramatic updates to his long-term market thesis that I will review below, and then comment on further. I recommend reading John’s full article: Topping Patterns and the Genuine Cause for Optimism. (First 6 exhibits that follow are from Hussman’s Feb. 17 article.)
First, John reproduces a graph he’s been updating frequently, using a methodology from Didier Sornette’s Why Stock Markets Crash:
Next Hussman explains a technical pattern known as “3 peaks and a domed house,” attributed to George Lindsay’s Art of Technical Analysis, which was edited and updated by George Carlson in 2011. The pattern is shown below — Hussman asserts that we are most likely at point 27 in the pattern — the one just before a market crashes:
The Shiller P/E10 (or “CAPE,” for cyclically-adjusted P/E ratio), is one of the most popular metrics analysts cite as signaling overvaluation. Some analysts have questioned if the P/E10 is as relevant as it once was, however. (This article by Chris Turner via Advisor Perspectives explains how analysts use the P/E10 to estimate the fair value of the S&P 500.)
I have written several articles on how the P/E10 forecasts long-term stock returns (including The Journal of Portfolio Management, June 2007). Below I’ve updated the exhibits from a 2012 article I published in Problems and Perspectives in Management, entitled Could US Stocks be Fairly-Valued Under the “New Normal” Paradigm? The graph shows that, as of year-end 2013, US stocks were overvalued based on historical values of the P/E10, but only by as much as 8.6% if investors are benchmarking “normal” to the post-1982 period (the start of the last secular bull market):
Conclusion: Both a Sornette log-period bubble and a Lindsay “3 peaks and a domed house” formation are evident in US equity values in late 2013 through early 2014. These patterns have preceded the bursting of stock market bubbles in 1929, 1973 and 2000. Additionally, US stocks are “overvalued” based on a traditional P/E10 CAPE, but are within the high range of normal valuation if the market no longer benchmarks to a 10-year moving average of earnings and/or a 130-year history of relative valuation.
Consistent with a large body of research (Shiller’s Irrational Exuberance included), it’s extremely difficult — and perhaps impossible — to see a bubble through the windshield. Only after the bubble bursts, and we can study it in the rear-view mirror, can we rationally deconstruct how we got there and why we couldn’t back away from the precipice with sufficient caution not to burst the bubble. I see current circumstances as another of these instances. Investor enthusiasm for “buying the dips” makes it difficult to forecast the imminent bursting of a bubble, unless there are further negative developments in the unfolding global credit market downturn. I would recommend assuming a strongly defensive position only if global volatility increases significantly. This week’s news flow bears close watching.